5 性能优化工具
perf
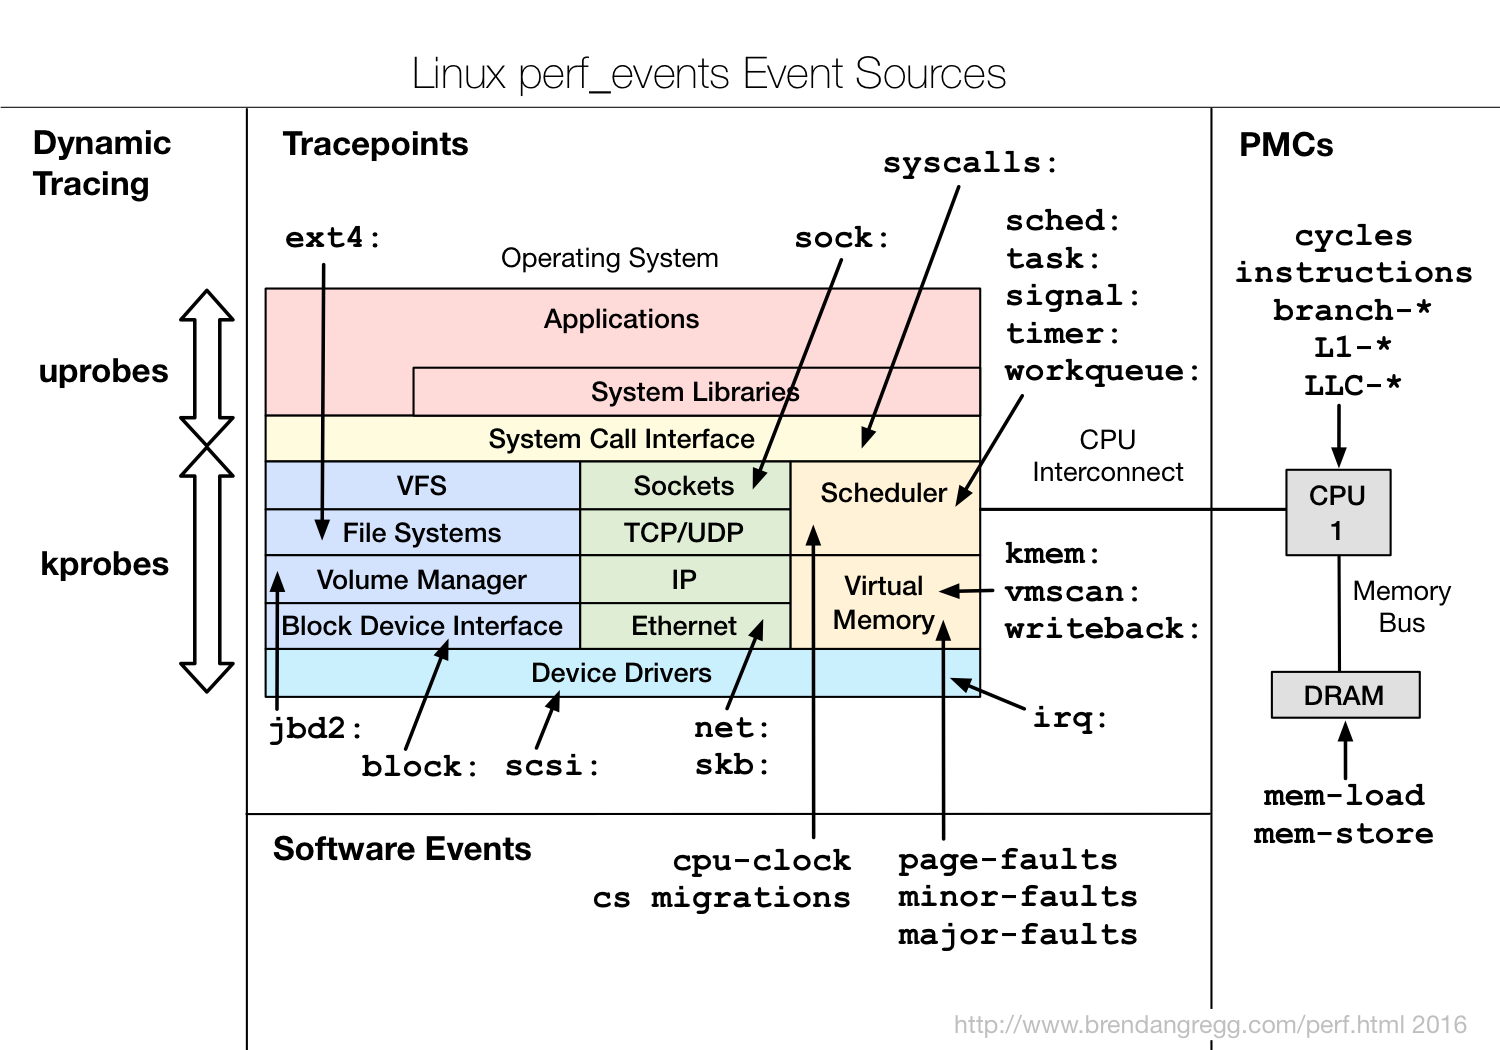
https://www.brendangregg.com/perf.html
火焰图
coz-profiler
https://github.com/plasma-umass/coz
eBPF
VTune Profiler
Toplev
https://github.com/andikleen/pmu-tools/wiki/toplev-manual
BCC tools

https://github.com/iovisor/bcc
pcm Intel® Performance Counter Monitor
pmu-tools
https://github.com/andikleen/pmu-tools
perf-tools

https://github.com/brendangregg/perf-tools
iodlr Tools and Reference Code for Intel Optimizations (eg Large Pages)
https://github.com/intel/iodlr
nanoBench
https://github.com/andreas-abel/nanoBench
Latencytop
可以测试出内核态和用户态导致系统延迟的原因
PSI(Pressure Stall Information)
PSI 是 Linux 内核中的一项功能,旨在提供有关 CPU、内存和 I/O 子系统的性能压力情况的信息。它通过跟踪和报告不同子系统中的“压力事件”,帮助分析师和开发人员确定系统是否正在经历性能瓶颈。
https://facebookmicrosites.github.io/psi/docs/overview.html
trace-cmd
https://www.p99conf.io/session/analyze-virtual-machine-overhead-compared-to-bare-metal-with-tracing/
bpftrace
查询所有内核插桩和跟踪点
sudo bpftrace -l 'open'
systemtap
SystemTap 是一个在 Linux 系统上进行系统级跟踪和探测的工具。它提供了一种灵活的方式,通过编写脚本来捕获和分析系统的内核和用户空间活动。
orbit C/C++ Performance Profiler
https://github.com/google/orbit
proc 文件系统
trace 文件系统
BOLT
https://github.com/facebookincubator/BOLT
C++
Compiler Explorer
查询 C++ 代码编译成的 汇编代码
Quick C++ Benchmark
https://quick-bench.com/q/eP40RY6zDK-eJFdSSPBINa0apTM
Compare C++ Builds
可以测试、比较不同 C++ 代码的编译开销(CPU、内存、I/O)
https://build-bench.com/b/47ciR2_jQ0RuAt2fy1Pnk66b3yM
C++ Insights
C++ Micro Benchmark
https://github.com/google/benchmark
数据库 benchmark 框架
BenchBase
BenchBase (formerly OLTPBench) is a Multi-DBMS SQL Benchmarking Framework via JDBC.
https://github.com/cmu-db/benchbase
sysbench
sysbench --db-driver=mysql --mysql-host=<hostname> --mysql-port=<port> --mysql-user=<username> --mysql-password=<password> --mysql-db=testdb --table-size=10000 --tables=1 --threads=1 --time=0 oltp_prepare


sysbench --db-driver=mysql --mysql-host=<hostname> --mysql-port=<port> --mysql-user=<username> --mysql-password=<password> --mysql-db=testdb
--threads=8 --time=10 oltp_run
dbbench
https://github.com/memsql/dbbench
pointer-chasing
Utilities to measure read access times of caches, memory, and hardware prefetches for simple and fused operations
https://github.com/afborchert/pointer-chasing
性能压测工具
Stress
Stress-ng
SysBench
Apache Bench
mysqlslap
mysqlslap -u root --password=xxx -h 127.0.0.1 -P 888 0 -c 1 -i 1 --create-schema=test --query="sql-groupby-string-string_int_int";
Locust
mysqlslap 不适合高并发压测,当进行高并发压测时,可以使用 Locust。
Locust 支持分布式压测,统计指标更完善,支持压测结果可视化,支持 Python 脚本编写压测用例。